Yield curve inversion mechanics and 4 proven indicators that reveal hidden economic danger
Yield curve inversions are widely feared yet routinely misunderstood by everyday investors. By breaking down the exact mechanics of duration, bank lending margins, and credit spreads, this guide reveals why the curve flips and what signals genuine systemic risk.
Mastering yield curve inversion mechanics allows disciplined capital allocators to decode institutional distress long before panic spreads across public equity and credit exchanges. While the financial press routinely treats an inverted yield curve as an ominous superstition, its predictive power does not stem from mystical market foresight. It arises from the cold mathematical reality of how money moves through the banking system, how commercial credit contracts, and how bond traders price risk across time.
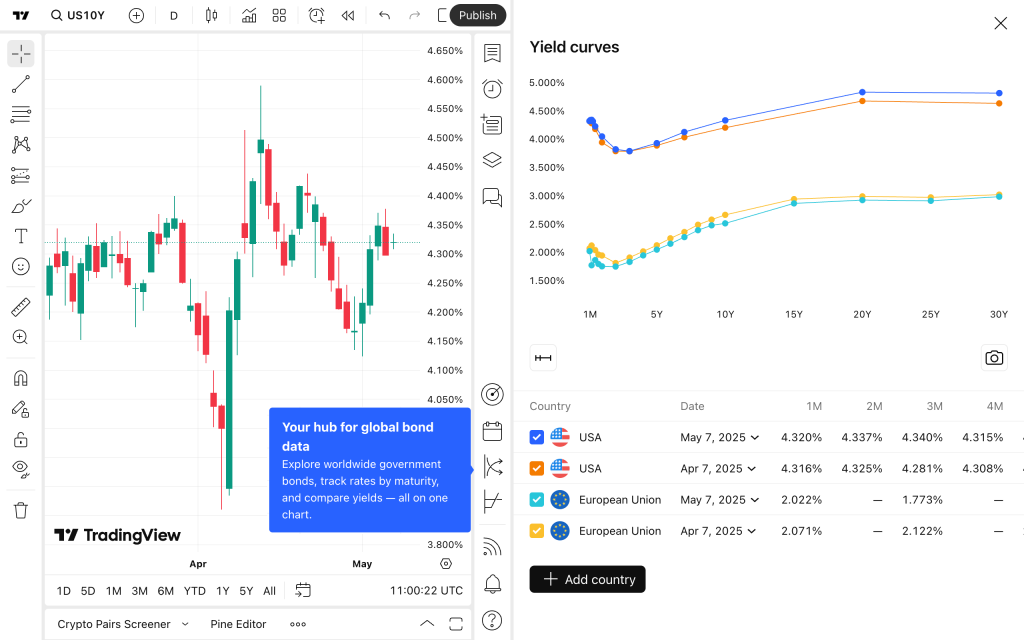
At its baseline, a healthy sovereign yield curve slopes upward from left to right. An investor locking their capital away in a ten-year sovereign bond naturally demands a higher annualized return than someone buying a three-month Treasury bill. That premium compensates the lender for uncertainty, inflation exposure, and duration risk. When that orderly relationship flips upside down, it signals that the economic transmission belts are grinding against intense structural resistance.
The Fundamental Plumbing of Fixed Income Duration
To grasp why the yield curve tilts into negative territory, one must examine the baseline incentives of fixed-income investors. Under normal macroeconomic conditions, longer maturities require a term premium. If you lend capital for thirty years, you expose your purchasing power to unpredictable inflationary spikes, fiscal expansion, and policy shifts. Short-term debt instruments, conversely, face minimal duration risk because they mature within days, weeks, or months, letting lenders roll over capital at prevailing market rates.
At its physiological core, yield curve inversion mechanics reflect a profound distortion in how lenders price duration risk. When institutional asset managers anticipate economic deterioration, they realize that policy rates will eventually crash downward. To lock in current returns before those emergency rate cuts arrive, large-scale capital pools aggressively buy long-dated sovereign bonds. This sudden, massive buying wave drives long-term bond prices upward and pushes their yields sharply downward.
Simultaneously, the central bank may be actively fighting elevated inflation by tightening liquidity at the front end of the curve. By hiking overnight lending targets, monetary authorities make short-term borrowing expensive. The front end stays pinned high by regulatory decree, while the long end collapses under private sector demand for safety. The spread between short and long maturities narrows, flattens, and eventually turns negative.
What Actually Happens to Bank Liquidity When Rates Cross Over
The true danger of an inversion does not reside on price charts or Wall Street commentary panels. The hazard lives squarely within the plumbing of commercial banking balance sheets. Traditional retail and commercial banks operate on a simple economic model known as maturity transformation. They borrow short-term money from retail depositors and overnight funding facilities, then lend long-term money to homebuyers, commercial developers, and expanding businesses.
When analysts fail to grasp yield curve inversion mechanics, they often mistake momentary bond market fluctuations for benign technical adjustments. Yet in the operational banking world, an inverted curve detonates profitability. When a bank must pay four or five percent interest to prevent retail depositors from fleeing into government money market funds, but can only collect four percent on thirty-year residential mortgages or prime corporate credit, its net interest margin vanishes. Lending becomes unprofitable on a risk-adjusted basis.
Rather than deploying capital into high-risk business expansions, cautious loan officers tighten underwriting standards. Credit lines are slashed, loan covenants become restrictive, and speculative financing evaporates. Because the modern commercial economy runs entirely on continuous credit refinancing, this banking freeze starves real-world enterprise of operational working capital. The inversion does not merely forecast a recessionary slowdown; it actively manufactures one by choking bank balance sheets.

4 Proven Indicators That Signal Severe Systemic Stress
A granular review of yield curve inversion mechanics across twentieth-century credit cycles demonstrates that an inverted curve acts as a coiled spring rather than an immediate detonator. The raw flip itself rarely triggers an instantaneous market crash. Instead, it starts an invisible operational countdown that exposes structural rot across the broader financial ecosystem. Dissecting the following four markers separates true warning signals from transitory market noise.
The Violent Un-Inversion Snapback
Superficial market participants frequently cheer when an inverted curve begins steepening back toward positive territory, assuming the economy has avoided disaster. Seasoned fixed-income desks understand the exact opposite reality: the most dangerous phase of the macro cycle is the bull steepener that un-inverts the curve. This happens when the central bank abruptly abandons its restrictive stance and aggressively cuts short-term policy rates because something inside the financial plumbing has broken.
Financial markets experience a psychological whiplash when long-dormant risks suddenly materialize in real time. Much like the chaotic shifts documented when NASCAR Standings Rattled by 4 Major Playoff Shocks at Phoenix, where unexpected collisions and split-second track incidents turn guaranteed leads into sudden deficits, credit markets can turn from complacency to absolute panic in a matter of trading sessions. When the yield curve un-inverts at breakneck speed, it confirms that policy authorities are racing to contain an accelerating liquidity crisis.
Commercial Bank Net Interest Margin Collapse
The second reliable warning signal reveals how yield curve inversion mechanics choke off profitable credit origination across the regional banking sector. Monitoring regulatory filings for net interest margin compression offers unvarnished insight into credit availability. As funding costs catch up with asset yields, banks face severe deposit betas, meaning they must pay ever-higher yields to keep commercial deposits on their books.
According to comprehensive Federal Reserve Bank of San Francisco economic research on term spreads, the spread between the ten-year Treasury yield and the three-month Treasury bill provides exceptional predictive accuracy for real economic contractions. When bank earnings reports confirm that margin compression has forced executive committees to shrink loan books and hoard liquid cash, the financial system shifts from expansionary credit creation to defensive contraction.
Corporate Credit Spread Decoupling
During the opening phase of a sovereign yield curve inversion, corporate junk bonds and investment-grade paper often trade with bizarre serenity. Because cash reserves accumulated during prior credit expansions temporarily insulate corporate balances, credit spreads remain artificially compressed. Investors fall into the trap of believing that low default rates will endure indefinitely despite punitive debt refinancing costs.
A fatal fracture occurs when the inversion persists beyond twelve months. Lower-tier corporate borrowers discover they cannot roll over maturing medium-term syndicated loans without facing punishing interest burdens that exceed their operational earnings before interest, taxes, depreciation, and amortization. When credit spreads violently decouple from tight benchmarks and blow outward, debt covenants fail, restructurings accelerate, and enterprise valuations plunge.
The Restrictive Gap Between Policy Rates and Neutral Equilibrium
A fourth critical diagnostic lies in evaluating the spread between the actual central bank policy rate and the theoretical neutral rate of interest, frequently designated as r-star. The neutral rate represents the exact interest rate level that neither stimulates nor restricts sustainable economic output. When central bankers hold policy rates significantly above this equilibrium point to crush core inflation, the front end of the curve freezes into deeply restrictive territory.
This policy friction suppresses aggregate demand by raising the hurdle rate for every major capital expenditure. Corporations postpone manufacturing plant expansions, cancel software infrastructure overhauls, and freeze headcounts. The wider and longer this restrictive interest gap remains open, the higher the mathematical certainty that debt service costs will outstrip corporate productivity gains.
Common Blindspots and False Comfort Traps
Whenever a sovereign curve inverts, a chorus of Wall Street forecasters predictably announces that the historical indicator has lost its validity. Institutional portfolio managers who misread yield curve inversion mechanics frequently point to term premium compression as justification to remain aggressively levered. They argue that massive sovereign wealth fund demand, foreign central bank reserve management, or quantitative easing residuals have permanently distorted the bond market, making traditional term spread analysis obsolete.
History repeatedly exposes this reasoning as flawed rationalization. While global regulatory requirements like Basel III liquidity coverage ratios undoubtedly increase institutional appetites for sovereign paper, they do not neutralize the systemic damage inflicted on commercial credit creation. An inverted curve drains liquidity from private lending pipelines regardless of why institutional investors bought the long end. Dismissing the curve because duration demand appears unusually high is mistaking the symptom for a structural cure.
Another classic blindspot is assuming that a long lag between inversion and recession equals a false signal. Inversions operate on long, variable timelines. The chronological gap between the initial negative spread and peak economic contraction historically stretches between twelve and twenty-four months. Mistaking this delay for resilience encourages investors to take on ill-advised equity risk at the absolute top of the business cycle.
Strategic Capital Allocation in Distorted Rate Environments
Surviving and thriving throughout an inversion cycle requires discarding common assumptions about passive indexing and unmanaged credit risk. When sovereign bond slopes flip, capital preservation and balance sheet quality take immediate precedence over speculative capital appreciation. Sophisticated allocators avoid chasing low-quality corporate debt simply because its headline yield looks appealing; high coupon yields mean little if principal recovery collapses during restructuring.
Instead of trying to time the precise market bottom, seasoned investors adjust their duration laddering. Holding high-quality, ultra-short paper allows capital allocators to collect attractive risk-free yield while maintaining total liquidity. When the eventual bull-steepening arrives and distressed assets sell at deep discounts, holding pristine liquidity enables the swift capture of generational mispricings.
By respecting the real-world operational truth of yield curve inversion mechanics, investors can safeguard principal while positioning for distressed opportunities. A flat or inverted term structure is not an academic oddity to be argued away by optimistic commentators. It is a fundamental declaration by the bond market that capital is being misallocated, balance sheets are under pressure, and a comprehensive economic reset is already underway.