Order book mechanics and 4 proven rules to eliminate costly slippage
Behind every financial chart lies an invisible engine of resting bids and aggressive market orders. Discover how order book dynamics dictate pricing, liquidity, and execution quality across modern electronic exchanges.
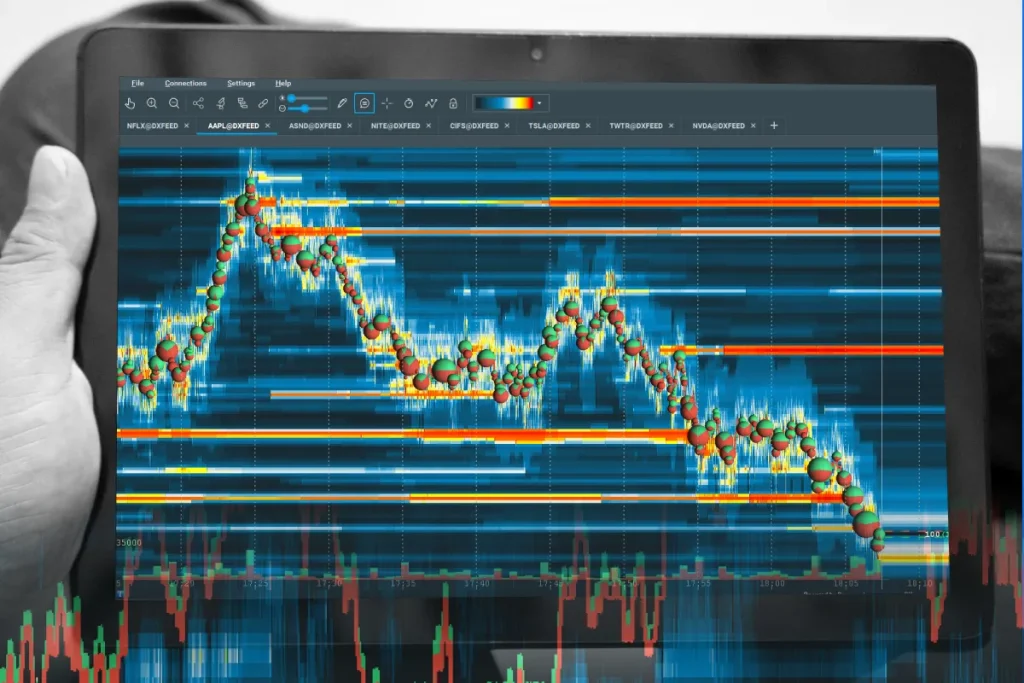
Mastering order book mechanics gives market participants an undeniable edge because every candlestick chart is merely a delayed shadow of real-time trading liquidity. Most retail investors evaluate assets through historical price curves, treating a stock, currency, or commodity like an abstract geometry puzzle. They watch moving averages cross and draw trendlines across peaks, assuming these lines possess intrinsic gravity. Yet the real engine driving every fractional price tick is an invisible, high-velocity ledger operating inside exchange matching engines.
Whenever capital changes hands on electronic exchanges like NASDAQ, the Chicago Mercantile Exchange, or decentralized protocols, the trade does not materialize out of thin air. It is brokered by a continuous double auction. This mechanism organizes outstanding participant intent into discrete queues of supply and demand. Studying the foundational principles of order book mechanics reveals that price does not move on sentiment alone; it moves when aggressive orders consume resting liquidity across predetermined tick increments.
Understanding this architecture changes how you perceive financial risk. Slippage, sudden liquidity voids, and unexpected execution gaps cease to feel like bad luck. Instead, they expose predictable structural bottlenecks within the exchange matching engine. By peering behind the visual facade of price charts, traders and serious capital allocators can evaluate market depth with surgical precision.
The Invisible Architecture Beneath Every Market Trade
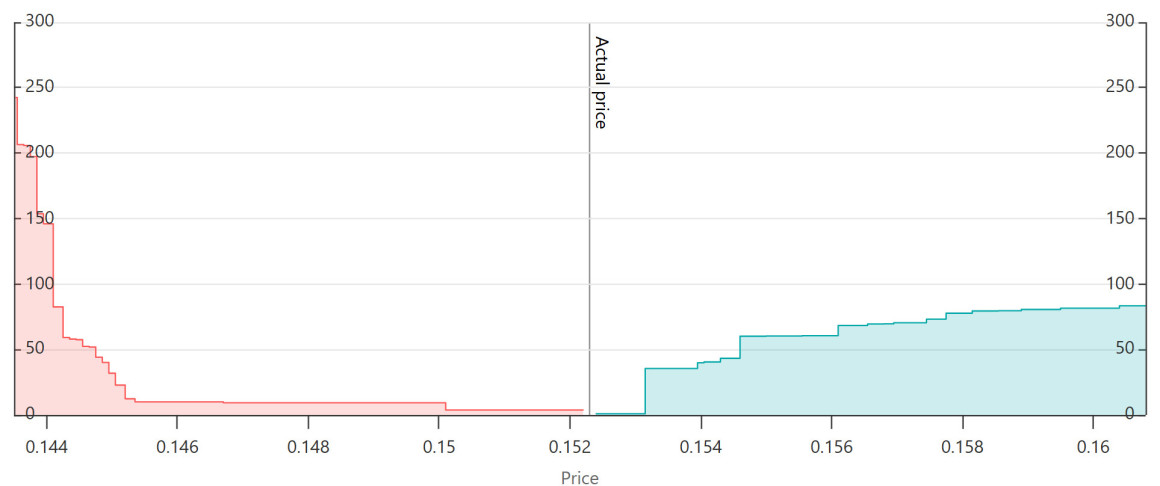
At its core, an electronic order book is an organized database of resting limit orders, separated cleanly into bids and asks. The bid side documents buy interest arranged in descending order from the highest price someone is willing to pay. The ask side records selling interest arranged in ascending order from the lowest price someone is willing to accept. The space separating the highest bid from the lowest ask constitutes the bid-ask spread.
This structure relies on a fundamental division between passive and aggressive orders. Passive participants submit limit orders, which sit within the queue at a specific price point, waiting for an opposing counterparty. These participants provide liquidity. Aggressive participants, by contrast, submit market orders to secure immediate execution at any available price. These participants consume liquidity. When an aggressive buyer enters the arena, the matching engine instantly matches their order against the cheapest resting limit order on the ask side.
Electronic matching engines govern this interaction through strict priority protocols. The most common standard is First-In, First-Out (FIFO) queue priority. Under FIFO, if two market makers post resting limit orders to buy shares at the exact same price, the order that hit the exchange matching engine first takes precedence. Other venues utilize pro-rata allocation models, where orders receive fills proportional to their displayed size rather than their arrival millisecond. As documented in a landmark Bank for International Settlements analysis of market microstructure, execution latency and queue ranking determine who captures value and who pays an adverse selection penalty.
How Bids Asks and Market Depth Really Interact
Price stability depends entirely on the thickness of resting volume across multiple price levels, commonly known as market depth. Level 1 data shows only the top of the book: the highest single bid and the lowest single ask. Level 2 data strips away this narrow filter, uncovering the full ladder of resting volume queued up and down the tick levels. When you observe a thick book with tens of thousands of shares resting within pennies of the mid-price, aggressive market orders can easily be absorbed without disrupting the prevailing quotation.
Conversely, a thin order book introduces profound volatility. If an institutional participant submits a five-thousand-share market buy order in a market where the top ask offers only five hundred shares, the matching engine does not pause. It fills the first five hundred shares at the best ask, then sweeps upward through the next tick level, consuming whatever inventory exists until the entire quantity is filled. This upward sweep is the physical reality of slippage. The trader paid a significantly higher average execution price simply because there was insufficient resting volume to absorb their size.
At the operational core of modern order book mechanics, this balance represents a delicate standoff between patient participants and urgent participants. Urgent capital pays for immediate execution by crossing the spread and accepting slippage. Patient capital earns execution value by waiting in the queue, but bears the risk of adverse selection—the danger that the order fills only when the market is crashing through their level.
Just as an athlete must master kinetic force transmission before attempting raw velocity, as explored in the breakdown of Sprint Acceleration Mechanics and 4 Proven Rules to Build Explosive Speed, an active market participant must understand structural transmission before sizing up positions. Without a functional grasp of how volume buffers price shocks, trading size without slippage remains an impossible objective.
The 4 Proven Rules to Navigate Liquidity and Prevent Costly Execution Errors
Managing execution risk requires a practical, repeatable approach tailored to live market conditions. Applying disciplined order book mechanics allows investors to look past surface volume and detect where genuine execution risk resides.
Identify Phantom Depth Before Deploying Capital
Displayed volume on an exchange screen is not a legal guarantee of executable liquidity. Algorithmic market makers frequently flash large passive orders to deter competitors or create an impression of insurmountable demand, only to cancel them milliseconds before incoming aggressive orders can strike. This phenomenon, known as fleeting liquidity, renders raw Level 2 depth misleading to untrained eyes.
To avoid misreading phantom liquidity, evaluate cancellation rates and execution ratios rather than static book snapshots. Furthermore, be aware of iceberg orders. These algorithmic trades divide massive institutional orders into a small displayed portion and a massive hidden reserve. When an iceberg sits at a key level, you will see a resting bid for one hundred shares absorb wave after wave of aggressive selling without disappearing. Recognizing the signature footprint of hidden reserves prevents you from trading against well-capitalized institutions operating behind the curtain.
Route Around the Spread During High Volatility
During macroeconomic news releases or rapid market sell-offs, market makers widen their spreads defensively to hedge against inventory risk. A bid-ask spread that usually measures two cents can instantaneously widen to fifty cents or more. Crossing that widened spread with a market order is an instantaneous, self-inflicted execution wound.
In fast-moving environments, abandon unconstrained market orders entirely. Utilize limit orders pegged to the near side of the book or employ post-only execution flags. A post-only tag guarantees that your order will only enter the book as passive liquidity. If market movement would force the order to execute immediately as an aggressive taker, the engine automatically cancels it. This simple tactical constraint preserves your capital by preventing catastrophic fills during sudden liquidity vacuums.
Match Order Types to Available Volume Profiles
Capital size must always be calibrated against available depth within the order book. When deploying significant positions, dividing your total execution into smaller increments is mandatory to avoid sweeping through multiple price rungs. Understanding how order book mechanics govern priority ensures your limit orders actually fill before rapid reversals occur.
Professional allocators utilize execution algorithms such as Volume-Weighted Average Price (VWAP) and Time-Weighted Average Price (TWAP). These algorithms slice parent orders into micro-chunks, feeding them into the queue at intervals that match historical liquidity distributions. By measuring your transaction size against the average depth of the top five book tiers, you can trade without tipping your hand to predatory high-frequency algorithms that hunt for market-impact footprints.
Decode the Hidden Imbalance Between Buyers and Sellers
Before a price candlestick moves upward or downward, the order book virtually always reflects an internal skew known as Order Book Imbalance (OBI). OBI measures the mathematical difference between total bid volume and total ask volume residing near the top of the book. When bid volume overwhelmingly outnumbers ask volume within the nearest three ticks, the mathematical probability of an upward tick increases exponentially.
Tracking real-time order book imbalance exposes where short-term supply exhaustion is occurring. If sellers are hammering a support level with market orders but the bid depth continually replenishes faster than it can be consumed, the sellers are running into institutional absorption. Recognizing this imbalance before the market reverses allows you to position alongside institutional inventory accumulation rather than chasing late momentum.
The Psychological Shift from Price Charts to Pure Order Flow
Relying solely on retrospective candlestick charts encourages emotional decision-making. Traders begin projecting narrative patterns onto lines, interpreting random oscillations as personal vindication or cruel betrayal. When market participants finally appreciate order book mechanics, the noisy charts and lagging indicators fade into the background. You stop asking what price did twenty minutes ago and begin analyzing where executable liquidity resides right now.
This mental shift completely redefines how you perceive market resistance and support. A resistance level on a chart is not an enchanted ceiling; it is simply a price band where a high concentration of resting limit sell orders outmatches available aggressive buying volume. The moment those resting limit orders are consumed, the barrier evaporates, and price advances to the next available queue of asks.
Mastering this dynamic replaces speculative guesswork with deterministic calculation. You begin treating every trade as an execution puzzle where spreads, queue positions, depth ratios, and fill probabilities dictate your strategy. Ultimately, a rigorous grasp of order book mechanics transforms chaotic price action into a clear mathematical landscape where risk is managed with surgical precision.