Bond yield curve mechanics reveal 4 essential forces driving market cycles
Yield curves map the pricing of time, credit, and collective human expectation. Learn the hidden structural mechanics that govern bond yields across every phase of the economic cycle.
Mastering bond yield curve mechanics provides an unvarnished window into the true cost of borrowing across time. While equity markets capture public attention with daily drama and explosive swings, the bond market serves as the quiet, foundational plumbing of the global financial system. Every corporate loan, municipal infrastructure bond, and mortgage rate takes its cue from the baseline yields established across government debt maturities.
A yield curve plots interest rates of bonds possessing equal credit quality against their differing maturity dates, creating a geometric footprint of human expectations. When capital allocators assess the cost of committing funds for three months versus thirty years, they engage in a multidimensional calculation. They evaluate purchasing power preservation, future central bank action, and the latent peril of unforeseen systemic crises. Understanding this structure transforms raw numbers into a panoramic assessment of macroeconomic health.
The Hidden Architecture of the Term Structure
At its core, the yield curve charts a mathematical progression known as the term structure of interest rates. If you purchase a three-month Treasury bill, your principal is returned rapidly, exposing your balance sheet to minimal price fluctuations. Conversely, buying a thirty-year bond ties your capital to a single issuer across decades of political shifts, technological disruptions, and inflationary waves. Consequently, yields across different points on the maturity spectrum rarely match.
To unpack bond yield curve mechanics, one must first dismantle the assumption that interest rates operate as a single, uniform lever. The curve is comprised of three distinct underlying instruments: par curves, spot rate curves, and forward rate curves. The par curve reflects coupon-paying bonds trading at their face value, whereas the spot curve reflects zero-coupon yields, isolating the precise discount factor for cash delivered at a discrete future date. Forward curves push the calculation further by extracting the implied interest rate for a loan negotiated today but disbursed in the future.
Traders rely on these mathematical transformations because coupon bonds pay incremental interest throughout their lifespan, muddying direct comparisons. By isolating zero-coupon discount factors, investors can price virtually any bespoke cash flow stream. When cash becomes dear or liquidity dries up, these mathematical relationships shift in real time, signaling tension before it manifests in broader asset prices.
Why Capital Demands an Enduring Time Premium
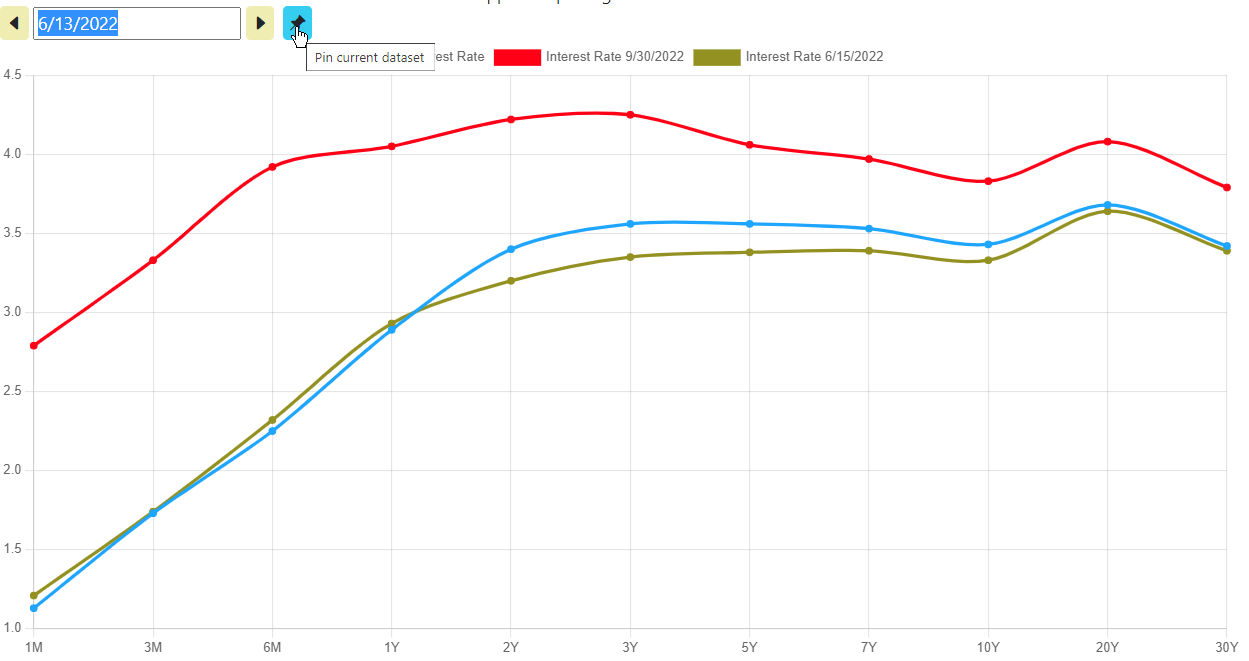
Under ordinary economic conditions, a yield curve slopes upward from left to right. Lenders naturally demand higher compensation for surrendering their liquidity over extended durations. An investor locking away money for two decades faces the constant threat that unexpected inflation will hollow out their purchasing power. To offset this peril, the market prices an additional margin of safety into long-dated instruments.
Here, the underlying bond yield curve mechanics reflect not merely math, but a tug-of-war between present gratification and future uncertainty. This added compensation is known as the term premium. The term premium is not a directly observable number; rather, it represents the yield differential between holding a long-term bond versus rolling over a series of short-term bills across that identical period. If investors expect a perfectly stable monetary environment, the term premium might remain modest.
When fiscal uncertainty deepens or inflation variability spikes, lenders refuse to surrender long-duration capital without substantial reward. This structural friction forms the bedrock of debt underwriting. When sovereign borrowers attempt to flood the market with long-term paper without satisfying this basic demand, bond vigilantes stage strikes by dumping debt, forcing yields upward until equilibrium returns.
Four Essential Forces Governing Yield Curve Transitions
When analyzing these shifts, sophisticated market participants observe bond yield curve mechanics through four distinct yet interlocking engines. The curve never moves in lockstep across its entire length. Instead, it twists, steepens, flattens, and shifts through dynamic inputs that reflect differing economic realities across short, intermediate, and long horizons.
Short Rate Expectations and Monetary Trajectory
The short end of the curve, spanning overnight financing up to two-year maturities, is heavily anchored by central bank policy. If policymakers decide to cool an overheated economy, they hike overnight borrowing rates. Short yields surge almost instantaneously to reflect this tighter stance. The expectations hypothesis posits that intermediate yields merely represent the geometric average of expected future short-term rates. When the trading desk anticipates sustained rate hikes, intermediate yields climb preemptively, flattening the slope between near-term cash and future promises.
Term Premium Volatility and Inflation Hedging
While the short end answers directly to policy benchmarks, the long end answers to long-term purchasing power expectations. Inflation is the ultimate enemy of fixed-income instruments because it erodes the real value of fixed coupon distributions. When inflation forecasts detach from historical baselines, long-duration paper experiences severe discount adjustments. The term premium expands aggressively as institutions demand extra yield to protect themselves from continuous debasement over ten to thirty years.
Supply and Demand Friction Across Maturity Buckets
Modern debt markets do not feature perfectly frictionless capital migration. According to preferred habitat theory, specific financial institutions operate under strict regulatory and balance-sheet mandates that bind them to designated maturities. Pension funds and life insurance companies, laden with predictable long-dated liabilities, must purchase twenty-year and thirty-year sovereign paper regardless of the prevailing business cycle. These portfolio adjustments prove how bond yield curve mechanics translate real-world balance sheet pressures into tangible pricing shifts.
Commercial banks, conversely, frequently prefer two-year to five-year maturities to match consumer deposits and revolving corporate facilities. When the government skews its issuance toward short-term bills to avoid high long-term coupons, it creates structural scarcity along the long end, depressing yields artificially. Conversely, heavy issuance of long-duration paper can overwhelm institutional balance sheets, driving yields up through supply overhang alone.
Cross-Border Arbitrage and Flight to Absolute Quality
Global capital moves across international borders in search of real yields and structural safety. Much like how wire service distribution mechanics reveal 4 proven systems that feed global newsrooms with synchronized data, primary dealer desks consume automated macroeconomic releases to instantly recalculate forward clearing curves. In moments of geopolitical conflict, sovereign debt from world-reserve currencies becomes a sanctuary asset.
Foreign capital cascades into liquid treasury benchmarks, compressing long-term yields even if domestic inflation remains stubborn. This international arbitrage breaks strictly domestic models. Quantitative analysts must constantly monitor cross-currency basis swaps and foreign exchange hedging costs, as shifts in these hedging rates determine whether foreign sovereign funds buy or liquidate domestic bonds.
Deciphering Shifts and Curve Inversions Without Academic Jargon
Market observers frequently categorise curve movements into four fundamental regimes: bull steepeners, bear steepeners, bull flatteners, and bear flatteners. The terminology distinguishes whether the curve moves due to buying pressure, which pushes prices up and yields down like a bull, or selling pressure, which forces yields up like a bear.
In a bear flattener, short-term yields jump rapidly as a central bank hikes aggressively, while long yields rise at a slower pace due to impending economic deceleration. In a bull steepener, short yields collapse rapidly as monetary authorities slash rates to stave off insolvency, giving the curve an abrupt upward slope. Each configuration informs corporate treasurers whether they should issue debt today or delay debt issuance until lower costs emerge.
The inverted yield curve, where short-term interest rates exceed long-term interest rates, represents an extraordinary breakdown of traditional economic compensation. When investors tolerate lower yields on ten-year paper than on two-year bills, they are declaring that future growth will weaken so dramatically that interest rates must eventually collapse. Comprehensive Federal Reserve research on term structure dynamics confirms that yield curve inversions have reliably foreshadowed post-war industrial downturns. It is an enduring indicator because it relies not on subjective sentiment surveys, but on real capital commitments made by sovereign and institutional market makers.
Building Resilient Portfolios Around Duration and Convexity
Understanding how bond yield curve mechanics interact with portfolio duration prevents catastrophic miscalculations during aggressive rate tightening. Duration measures an asset price sensitivity to interest rate fluctuations. A bond portfolio with a duration of seven years will roughly lose seven percent of its market value for every one percent climb in benchmark yields across that segment of the curve.
Convexity provides the second layer of defense. It measures the curvature of the price-yield relationship. Because the bond pricing equation is not linear, higher convexity means that when yields decline, prices rise faster than a straight-line duration model predicts. Conversely, when yields climb, positive convexity cushions the price drop, attenuating portfolio losses.
Fixed-income professionals deploy specialized curve configurations based on these properties. In a barbell strategy, an allocator concentrates exposure in short-duration paper for liquidity and very long-duration bonds for pure yield, avoiding the intermediate space. In a bullet strategy, capital is focused exclusively on a single intermediate node, such as the seven-year mark, protecting against wild shifts at either extreme of the maturity line. By demystifying bond yield curve mechanics, capital allocators cease viewing interest rates as unpredictable weather and instead treat them as an engineered structural framework.