
Bond Yield Curve Mechanics and 4 Proven Laws That Guard Against Brutal Market Crashes
The yield curve acts as the financial world’s most reliable seismograph, telegraphing economic earthquakes long before equity markets react. Understanding how sovereign debt yields shift across maturities reveals hidden systemic stress and preserves capital when tides turn.

Mastering bond yield curve mechanics allows astute investors to decipher the financial system’s most reliable early warning radar before sudden economic tremors dismantle unprepared portfolios. While equity markets run on sentiment, quarterly narratives, and momentum, sovereign debt desks trade on raw mathematical reality. When institutional capital senses systemic strain, money migrates quietly into fixed income, distorting normal pricing relationships between short-term cash instruments and long-duration paper.
Ignoring these subtle slope shifts leaves market participants completely blind to coming credit contractions. The sovereign yield curve provides a direct window into borrowing costs, banking profitability, and the aggregate collective expectations of global capital allocators. Decoding its inner geometry provides an unparalleled strategic advantage across every asset class.
The Hidden Physics of Sovereign Debt and the Term Structure
A foundational comprehension of bond yield curve mechanics begins with the term structure of interest rates, which plots the yields of sovereign securities across varying horizons from three months to thirty years. Under ordinary macroeconomic conditions, lending money for three decades carries substantially more hazard than parking capital for ninety days. An investor locking up funds across multiple market cycles faces inflation uncertainty, sovereign supply shifts, and the simple opportunity cost of illiquidity. Fixed income markets naturally compensate for this friction through a positive term premium, producing the classic upward-sloping baseline.
Behind this visual curve lies the fundamental relationship between bond price and interest rate movements. When yields climb, bond prices decline; conversely, falling yields spark capital appreciation. The mathematical sensitivity of a bond’s price to interest rate adjustments is governed by duration. Long-duration bonds exhibit dramatic price volatility when baseline discount rates move even a few basis points, whereas short-term bills anchor tightly to overnight central bank policy. When traders alter their expectations about future economic output, they adjust their holdings across these maturity buckets, twisting the slope of the curve in real time.
Decoding the Four Distinct Shapes of the Yield Curve
The sovereign debt curve continuously alters its contour across economic expansions and contractions. Tracking these adjustments requires identifying four archetypal curve postures that emerge throughout market cycles.
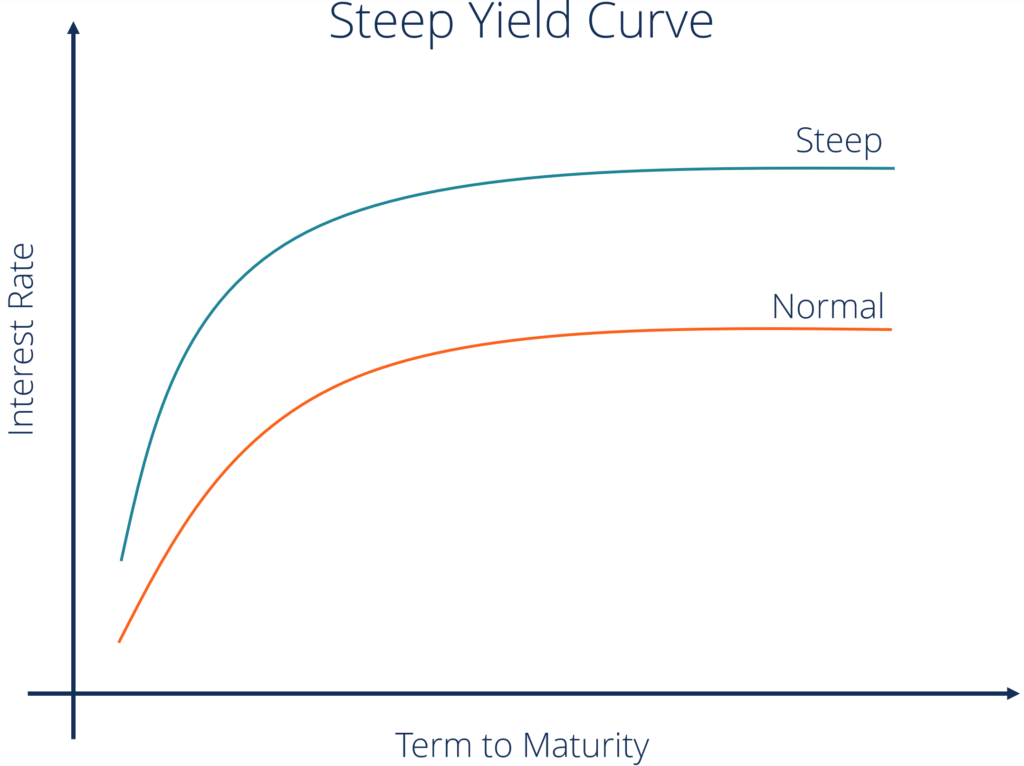
A normal curve maintains an upward gradient where thirty-year bonds trade at yields well above short-dated treasury bills. This configuration signals healthy economic equilibrium, stable lending spreads, and predictable corporate borrowing environments. A steep curve appears when the spread widens dramatically, typically emerging during early-stage recoveries as central banks pin cash rates to the floor while growth and inflation expectations drive distant yields higher.
A flat curve indicates mounting systemic hesitation. During this phase, short-term yields catch up to long-dated bonds as monetary authorities tighten policy to curb inflation, while long-duration buyers step in to cap long yields, betting on impending economic exhaustion. Finally, an inverted curve develops when short-term yields rise above long-term yields. This rare structural aberration reflects desperate capital locking in distant yields because traders anticipate severe economic deterioration and subsequent emergency rate cuts.
Commercial banks rely on borrowing short-term customer deposits to underwrite long-term loans. When the yield curve flattens or inverts, the traditional profit engine of commercial banking breaks down, strangling the private credit transmission mechanism. This fundamental commercial tension illustrates why bond yield curve mechanics remain the primary compass for institutional asset allocators worldwide.
Four Proven Laws of Yield Curve Behavior That Protect Capital
Rather than observing these shifting lines as abstract academic data, disciplined practitioners rely on definitive behavioral rules to shield their wealth from emerging financial disruptions.
Law One The Expectations Engine Dictates Curve Trajectory
Long-term sovereign yields do not fluctuate on random whim. Under the pure expectations hypothesis, a ten-year sovereign bond yield simply reflects the geometric average of expected future one-year interest rates plus an evolving risk premium. If the broader market calculates that growth will stall and policy rates must fall over the next decade, long yields drop regardless of where the central bank currently fixes its target rate.
Watching where distant forwards price capital reveals the market’s true collective verdict on growth potential. When sovereign paper consistently ignores central bank rhetoric and trades lower in yield despite public warnings of prolonged tightening, the expectations engine is declaring that official policy has overtightened and broken the underlying growth momentum.
Law Two Inversion Pressures That Erode Banking Liquidity
An inverted yield curve acts as a tourniquet on financial plumbing. Commercial lending desks generate their net interest margin by exploiting the spread between short-term funding costs and long-term asset yields. When ninety-day sovereign paper yields more than ten-year benchmarks, depository institutions face brutal structural margin compression.
Under these conditions, banks restrict credit lines, raise collateral standards, and halt balance sheet expansion. Highly leveraged corporations suddenly discover that working capital facilities cannot roll over smoothly. Corporate earnings and tech valuations often swing wildly under macro stress; as detailed in our analysis of how the Meta Share Price Surges After 4 Crucial Earnings Surprises and Stock Split headline dominated trading desks, market sentiment can detach temporarily from underlying rate regimes before capital costs force a broader valuation reckoning. Understanding these localized bond yield curve mechanics explains why credit contractions inevitably follow deep inversions across sovereign benchmark maturities.
Law Three The Unseen Sovereign Risk Built Into Term Premiums
Yields do not reflect policy rate predictions alone. The term premium represents the surplus yield that investors demand for assuming the price volatility and inflation risk of long-duration paper. In eras of extreme sovereign deficit spending, debt issuance explodes, flooding dealers with massive debt volume.
When primary dealers struggle to absorb trillions in new long-term bonds, term premiums spike rapidly, triggering a bear steepening event where yields march upward even without central bank assistance. This dynamic increases mortgage rates, sovereign borrowing friction, and corporate debt costs without a single official interest rate adjustment. Investors who overlook the term premium miscalculate how supply shocks destabilize the fixed-income complex.
Law Four The Bull Steepener Warning Signal for Systemic Easing
Many investors mistakenly assume that the yield curve inversion itself sparks immediate market distress. Fixed income history proves otherwise. The most perilous market phase frequently arrives during the un-inversion process, specifically when driven by a rapid bull steepener.
When analyzing bond yield curve mechanics during policy shifts, market veterans distinguish between pure rate level changes and structural slope alterations. A bull steepener occurs when short-term yields collapse far faster than long-term yields as central banks rush into panicked rate cuts to cushion a brewing shock. Equity multiples historically suffer their steepest drawdowns not while the curve is quietly inverted, but during the initial violent bull steepening episode when systemic cracks compel authorities to act.
Structural Pitfalls and Common Distortions in Fixed Income Analysis
A catastrophic misinterpretation of bond yield curve mechanics involves treating an inverted spread as an immediate sell signal rather than an operational countdown clock. The historical duration between the onset of curve inversion and real-world asset contraction can stretch from twelve to twenty-four months. Dumping productive assets on the first day of an inversion guarantees leaving late-cycle gains on the table.
Another common mistake involves fixating exclusively on the spread between ten-year and two-year sovereign debt while overlooking the shorter, more direct policy spread between ten-year bonds and three-month bills. As documented in extensive Federal Reserve Bank of New York capital markets analysis, the ten-year minus three-month metric has historically demonstrated superior statistical reliability when forecasting severe economic decelerations and banking system illiquidity.
Modern quantitative interventions further complicate baseline observations. Large-scale asset purchase programs by monetary authorities artificially compress term premiums by vacuuming duration out of the public market. When central banks expand or shrink balance sheets, they create artificial distortions that alter traditional yield dynamics. Analysts must adjust their models to account for balance sheet footprints rather than reading raw yield spreads at face value.
Navigating Capital Allocation When the Curve Begins to Shift
Capital preservation demands tailored portfolio adjustments as curve shapes evolve. When an expansion reaches mature stages and flattening transitions toward deep inversion, institutional managers transition from aggressive credit risk into high-quality cash equivalents and duration hedges.
During flat and inverted regimes, barbell allocation strategies often outperform standard linear portfolios. By holding ultrashort sovereign bills to capture elevated front-end yields while simultaneously maintaining an allocation to high-duration sovereign debt, an investor secures defensive liquidity while positioning for massive capital appreciation when the curve violently steepens.
As the inevitable bull steepener begins and monetary authorities deploy liquidity injections, the strategic playbook rotates. Yields on cash instruments drop rapidly, penalizing risk-averse savers who parked money too long. Astute allocators use that transition to migrate capital away from sovereign duration and re-enter beaten-down real estate assets, sound equities with defensive balance sheets, and high-quality corporate credits. Ultimately, respecting bond yield curve mechanics separates emotional traders from resilient stewards of enduring wealth.