Bond yield curve mechanics and 4 proven rules to navigate devastating market inversions
A deep exploration of the structural forces shaping sovereign debt maturities and how to read curve slope signals with institutional clarity.
Mastering bond yield curve mechanics allows investors to decipher the collective wisdom of global debt markets before macroeconomic shifts trigger devastating equity sell-offs. While financial headlines often reduce the yield curve to a binary recession alarm, it is far more than a simplistic flashing red light. The curve represents a continuous, living mathematical surface where trillions of dollars in capital negotiate the exact price of time, uncertainty, and liquidity across decades.
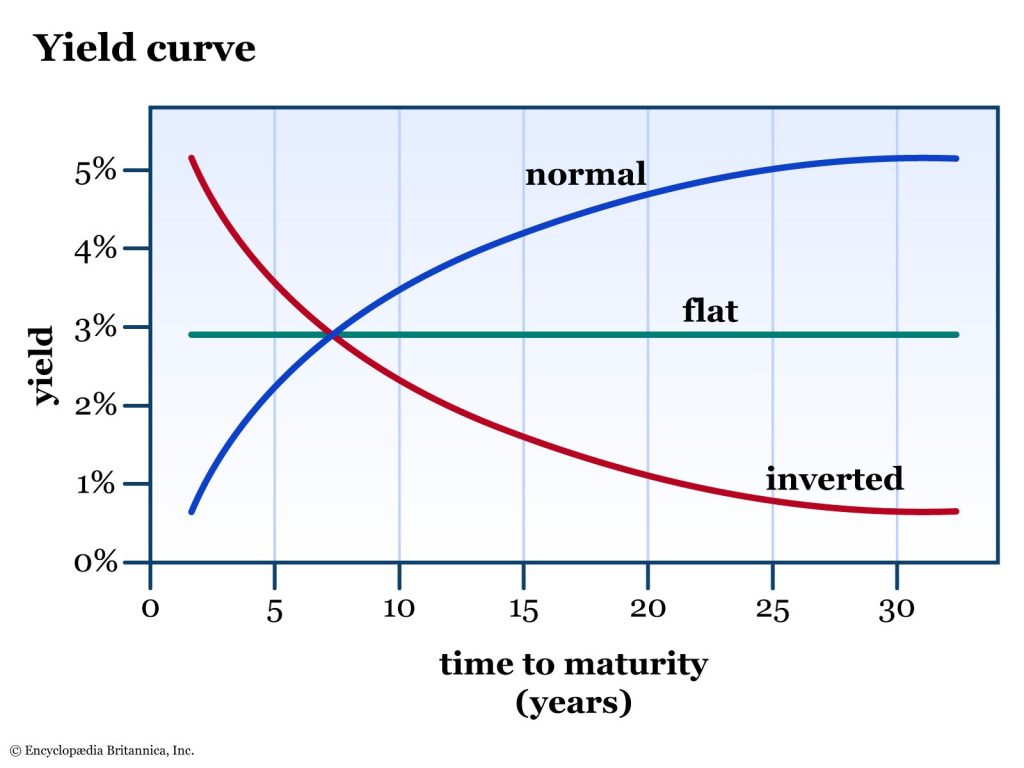
At its simplest, a yield curve plots the interest rates of bonds possessing equal credit quality but differing maturity dates. When you map yields from short-term bills maturing in four weeks out to sovereign bonds extending thirty years, you construct a geometric snapshot of systemic confidence. Under normal economic conditions, the curve slopes upward. Lending money for three decades carries vastly more unknown risk than lending it for three months, so creditors demand higher yields to compensate for time risk. Yet when market plumbing experiences severe stress, this orderly progression buckles, producing flat, inverted, or violently steepened profiles that trap unsuspecting portfolios.
The Core Anatomy of the Yield Curve
To grasp how the curve shifts, one must separate the instrument from the curve itself. A fixed-rate bond is an obligation to deliver fixed cash flows over time, culminating in the return of principal at par. Because these contractual coupon payments are static, the market price of the bond must fluctuate inversely with interest rates to ensure its yield to maturity matches prevailing conditions. When benchmark rates climb, older low-coupon debt drops in price. When benchmark rates plunge, existing bonds trade at a premium.
Across the sovereign maturity spectrum, yields do not move in lockstep. The short end of the curve, spanning overnight financing to roughly two-year debt, is anchored directly to central bank policy rates and near-term liquidity conditions. In contrast, the belly of the curve, generally covering five-to-seven-year maturities, reflects medium-term economic growth expectations and private sector credit demand. Finally, the long end, spanning ten to thirty years, responds to secular inflation trends, sovereign credit credibility, and structural demographic shifts.
When these segments diverge, the slope alters. Practitioners track the relationship between specific benchmark pairs, most notably the spread between two-year and ten-year yields, alongside the gap between three-month treasury bills and ten-year notes. When the yield on the shorter instrument rises higher than the yield on the longer instrument, the curve inverts. This phenomenon defies everyday banking logic: why would lenders accept a smaller annual return to tie up their wealth for ten years than for ninety days? The answer lies inside the underlying structural forces that govern capital preservation.
Three Invisible Forces Dictating Slope and Shape
Deconstructing bond yield curve mechanics requires peeling back three interlocking dynamics that drive pricing across maturities. The shape of the curve is not determined by a single monolithic consensus, but rather by the friction between expectations, risk premiums, and institutional mandates.
The first engine is the Pure Expectations Hypothesis. This theory posits that long-term yields represent nothing more than a geometric compounding of anticipated future short-term rates. If market participants believe the central bank will keep overnight borrowing costs elevated for two years before slashing them rapidly to combat a sudden economic crash, long-term yields will drift downward in advance. Investors willingly purchase ten-year paper yielding less than cash today because they believe that over the total ten-year horizon, locking in that moderate return will outperform holding rolling short-term cash instruments that will soon yield near zero.
The second force is the term premium. Far from an abstract concept, the term premium is the excess yield that debt investors demand to bear the hazard of unexpected inflation and duration risk over long horizons. Purchasing thirty-year sovereign debt exposes capital to decades of potential currency debasement and rate volatility. If inflation suddenly spikes by several percentage points five years into a thirty-year bond, the purchasing power of those fixed coupon payments evaporates. When the term premium compresses into negative territory, as happens during intense flight-to-safety episodes, market participants become so desperate for guaranteed balance sheet collateral that they forfeit any compensation for time risk.
The third force is institutional segmentation, often called the preferred habitat theory. Global financial actors are bound by strict legal, regulatory, and liability mandates. Life insurance companies and defined-benefit pension funds must match thirty-year liabilities with long-duration fixed-income assets, regardless of short-term policy rates. Meanwhile, commercial banks and corporate treasury departments primarily operate at the short end to maintain daily working reserves. These rigid institutional mandates create persistent supply-and-demand imbalances across specific maturities, generating localized kinks and twists in the curve that raw economic theory cannot explain alone.

Four Proven Rules for Navigating Severe Curve Distortions
A disciplined understanding of bond yield curve mechanics provides the necessary clarity to position portfolios when financial conditions tighten. Rather than reacting with panic to yield curve headlines, seasoned debt managers evaluate curve movements through structured rules that isolate signal from noise.
Distinguish Between Bear Flattening and Bull Inversion
Not all yield curve compressions stem from the same macroeconomic driver. Investors must determine whether the curve is flattening because short yields are rising faster than long yields, or because long yields are falling faster than short yields. The former is a bear flattener. It typically unfolds when monetary authorities aggressively tighten policy to choke off persistent inflation while long-term growth prospects hold relatively stable. In this environment, cash equivalents and floating-rate debt outperform long-duration paper.
Conversely, a bull flattener occurs when long-term yields crater while short-term rates remain relatively rigid. This dynamic signals that large institutional players are actively dumping risk assets to lock in long duration, anticipating an imminent liquidity crisis or severe economic contraction. Confusing a bear flattener with a bull flattener leads to catastrophic allocation errors. In a bear flattener, long bonds bleed capital due to duration exposure, while in a bull flattener, long bonds produce massive capital gains as benchmark yields collapse.
Measure the Pure Term Premium Rather Than Nominal Spreads Alone
Sophisticated practitioners who study bond yield curve mechanics look beyond raw yield differences and calculate the pure term premium. Nominal spreads can be heavily skewed by temporary central bank balance sheet interventions, foreign sovereign reserve recycling, or emergency bank liquidity backstops. Relying solely on the headline difference between two-year and ten-year bonds obscures whether an inversion is driven by genuine expectations of rate cuts or simply an artificially depressed term premium.
When the term premium is deeply negative, long-term bonds offer minimal buffer against macroeconomic surprises. If inflation remains stubborn or sovereign borrowing surges, requiring massive new debt auctions, the term premium can violently mean-revert upward. This upward re-pricing causes long-term bond prices to drop sharply even if central banks pause rate hikes. Monitoring term premium estimates keeps investors from walking into maturity traps where asymmetric downside risk lurks under the guise of an inverted safety net.
Hedge Negative Convexity Before Central Bank Reversals Accelerate
Duration measures a bond portfolio sensitivity to interest rate shifts, but duration is not a static constant. The relationship between bond price and yield is curved, a characteristic known as convexity. Standard fixed-coupon government bonds possess positive convexity, meaning their prices rise faster when yields drop than they fall when yields rise. However, mortgage-backed securities, callable agency bonds, and heavily leveraged debt structures frequently exhibit negative convexity.
As the yield curve approaches peak inversion and begins its violent un-inversion process, negative convexity turns toxic. When underlying yields fall, homeowners refinance their mortgages and corporations call high-yield bonds, returning capital to the investor precisely when reinvestment yields are deteriorating. This dynamically shortens the duration of mortgage portfolios during rallies and lengthens their duration during sell-offs. Hedging against negative convexity using interest rate swaps or long treasury futures prevents portfolio yields from evaporating at the precise moment rate cuts take hold.
Deploy Curve Steepeners to Safeguard Structural Liquidity
The un-inversion of the yield curve, rather than the initial inversion itself, is universally the most dangerous phase for broader risk assets. When an inverted curve rapidly steepens back into normal positive territory, it rarely occurs in a gentle, orderly fashion. Instead, it frequently takes the shape of a bull steepener, where the central bank frantically slashes front-end policy rates in response to a sudden systemic credit freeze or soaring unemployment.
Deploying curve steepener trades, either through interest rate futures, options, or weighted maturity allocations, functions as an exceptional systemic hedge. By positioning a portfolio to gain value as the yield spread widens, investors capture explosive upside when emergency liquidity injections compress short yields. This liquid cash flow provides dry powder to accumulate distressed high-quality assets at the depths of a broad liquidation cycle, turning structural market distress into generational wealth generation.
Common Duration Traps and the Anatomy of False Signals
When market participants misinterpret bond yield curve mechanics, they invariably fall victim to duration traps. The most widespread error is treating an inverted curve as an immediate signal to liquidate equities and hide in short-term paper. Historically, the lag between an initial curve inversion and a genuine economic recession averages between twelve and twenty-four months. Running to cash on the exact day an inversion registers frequently causes investors to forfeit the final, powerful blow-off rally of an aging business cycle.
Another dangerous misstep involves ignoring sovereign fiscal dynamics. In eras of unprecedented government deficit spending, sovereign debt issuance explodes. When the market is suddenly forced to absorb trillions of dollars in fresh supply, the long end of the curve can experience a severe bear steepener. In this regime, long yields rise much faster than short yields not because growth is booming, but because the market demands higher yields to digest an overwhelming deluge of bond supply.
Just as financial analysts must cut through speculative rumors by applying principles akin to News verification mechanics and 4 proven rules that expose dangerous media fabrications, debt investors cannot afford to accept superficial economic narratives at face value. A steepening curve caused by fiscal indigestion demands a defensive stance toward long-duration assets, whereas a steepening curve driven by aggressive monetary easing calls for aggressive duration acquisition.
Strategic Portfolio Construction Across the Rate Cycle
Synthesizing yield curve dynamics into actionable portfolio strategy requires abandoning static asset allocation models. Fixed-income allocations should shift dynamically between bullet and barbell structures depending on where the global financial system sits within the monetary cycle.
A bullet strategy concentrates portfolio maturities around a single intermediate point on the curve, such as the five-to-seven-year sector. This configuration performs exceptionally well during stable, mid-cycle expansions when the curve maintains a steady, upward slope with minimal volatility. It captures reasonable yield while avoiding the heavy reinvestment risk of ultra-short bills and the sharp price swings of thirty-year paper.
In contrast, a barbell strategy pairs ultra-short cash equivalents with ultra-long treasury paper while stripping out intermediate maturities. The barbell is the ideal weapon when navigating extreme yield curve distortions. The short end yields attractive, low-risk income and provides absolute capital liquidity. Simultaneously, the long end provides potent convexity protection that surges in price if a sudden liquidity shock forces a systemic flight to safety.
According to the foundational Federal Reserve Bank of New York yield curve analysis, the slope between short and long maturities remains one of the most reliable forecasting engines for future output contraction. By watching the mathematical interactions among duration, term premiums, and policy expectations, market participants bypass emotional panic. Ultimately, grounded bond yield curve mechanics transform an abstract economic graph into a concrete blueprint for long-term capital preservation.