Yield curve mechanics and 4 essential signals that expose economic shifts
Sovereign bond markets communicate economic reality long before equity desks react. Unravel the mathematical dynamics of the term structure and how shifts in curve geometry forecast macro cycles.

Mastering yield curve mechanics provides market participants with an unvarnished view of capital costs and collective economic expectations. While equities often react to emotional sentiment and quarterly headline surprises, the sovereign debt market operates on cold, structural arithmetic. The term structure of interest rates charts the yield of government obligations across maturities ranging from one month to thirty years. Under normal conditions, this line slopes gently upward. Investors demand a higher annualized return for locking away their cash for a decade than they do for three months because the distant future holds greater uncertainty regarding inflation, borrower solvency, and monetary policy shifts.
The Anatomy of the Term Structure of Interest Rates
At its core, yield curve mechanics depend on three distinct theoretical engines: pure expectations hypothesis, liquidity preference theory, and market segmentation. The expectations hypothesis posits that long-term yields simply reflect the financial market’s forecast of future short-term interest rates. If traders expect the central bank to slash benchmark rates over the next five years, long yields drop to match that discounted trajectory. Meanwhile, liquidity preference theory accounts for the inherent vulnerability of locking up principal. Investors inherently prefer liquid, immediate cash; convincing them to surrender that flexibility demands a term premium.
When these theoretical forces collide with real-world capital flows across institutional pension funds, foreign reserve managers, and commercial lenders, the resulting shape becomes the primary compass for macroeconomic discovery. Sovereign debt markets do not guess. They price trillions of dollars of balance sheet commitments based on the marginal utility of yield versus duration risk.
How Institutional Capital Reprices Risk Across the Horizon
Institutional asset allocators do not treat sovereign debt as a passive savings vehicle. They use government obligations as high-velocity instruments for risk transfer, collateral management, and balance sheet duration hedging. When market participants sense an economic regime change, capital shifts across maturities with breathtaking speed, driving yields down where demand surges and pushing yields up where supply overwhelms buyers.
The price of a fixed-coupon bond moves inversely to its yield because newly issued debt immediately recalibrates the baseline opportunity cost of money. A ten-year bond paying three percent loses nominal secondary value the moment prevailing market rates rise to four percent. The sensitivity of that price swing is defined by duration, an analytical measurement of cash-flow timing. Long-duration paper responds violently to minor basis-point adjustments, while short-duration bills remain anchored near the overnight benchmark rate set by monetary authorities. When traders dissect yield curve mechanics, they are essentially evaluating the price of time and the risk of unexpected inflation. If market participants lose faith in long-term monetary discipline, they demand a bloated term premium to absorb thirty-year paper. Conversely, when economic fear grips commercial credit channels, institutions dump volatile corporate equities and sprint into intermediate government debt, triggering sharp downward yield compressions that reshape the entire horizon.
Four Essential Signals That Expose Fundamental Economic Shifts
The geometry of the yield curve shifts through distinct regimes, each signaling a fundamental divergence between central bank policy and macroeconomic reality. Traders monitor the basis-point spread between various points on the curve to diagnose the health of credit creation.
The Classic Inversion Between Two Year and Ten Year Spreads
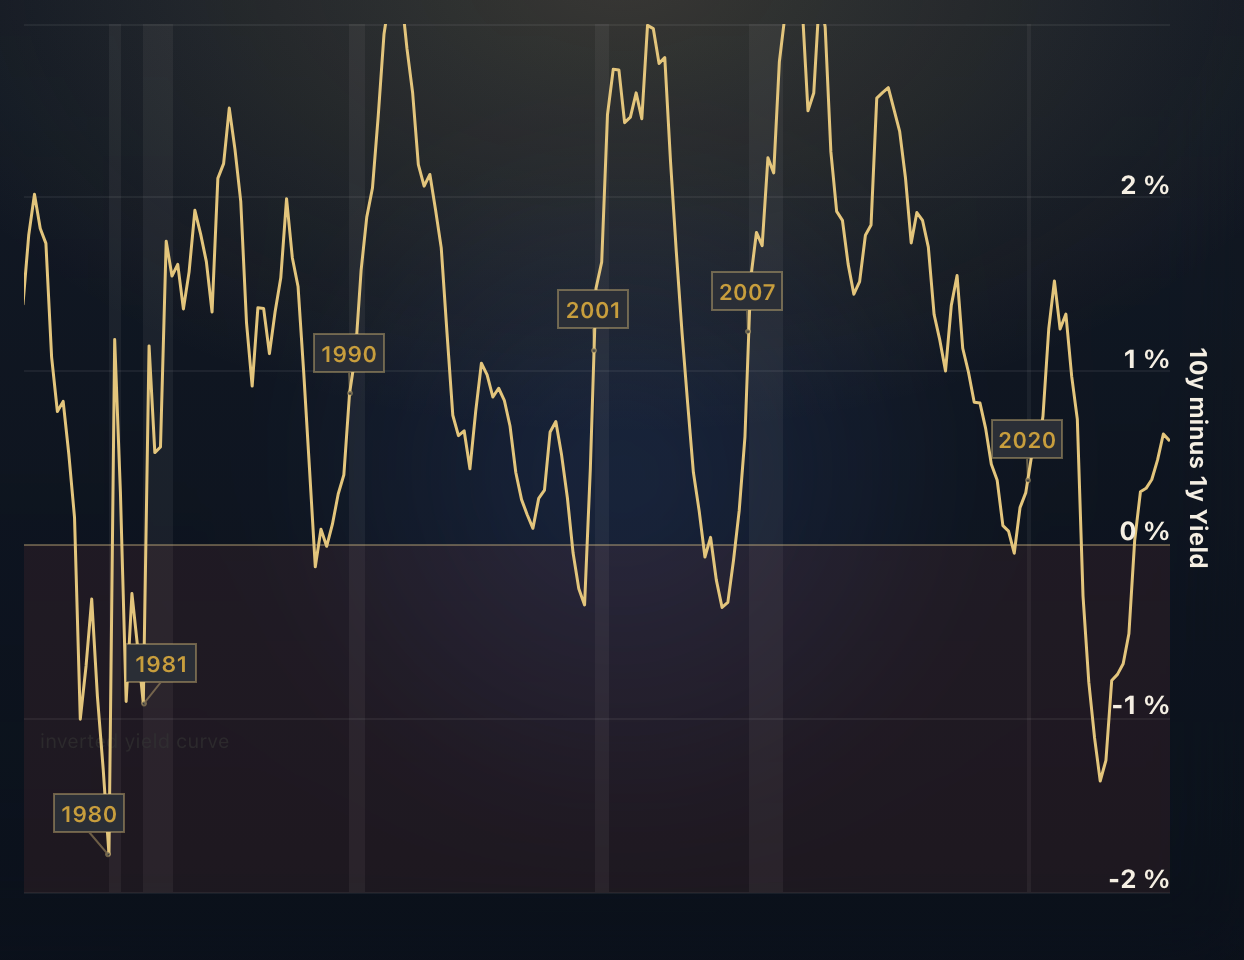
An inverted yield curve occurs when short-term yields climb above long-term yields, flipping the standard upward slope on its head. This distortion surfaces when a central bank raises policy rates aggressively to choke off consumer demand or eradicate stubborn inflation. The front end of the curve rises because it tracks the overnight lending rate. Meanwhile, the back end of the curve falls because large institutional allocators expect that restrictive policy will ultimately suppress economic growth, trigger rising unemployment, and force subsequent rate reductions. Careful observation of yield curve mechanics reveals that inversions do not trigger recessions by themselves; rather, they mirror institutional capital fleeing risk assets for sovereign safety. Historically, every sustained inversion of the two-year and ten-year spread over the past half-century has presaged an economic contraction, rendering it the most scrutinized warning light in global finance.
The Bear Steepener Driven by Inflationary Real Yield Expansion
A bear steepener develops when long-term interest rates surge significantly faster than short-term rates. In market parlance, bear denotes falling bond prices, which corresponds mathematically to rising yields across longer maturities. This phenomenon typically emerges when fiscal authorities flood the primary market with massive sovereign debt issuance to fund widening budget deficits, directly confronting weak buyer demand. Alternatively, a bear steepener takes hold when investors suddenly elevate their long-range inflation forecasts, demanding substantial yield premiums to compensate for purchasing power erosion over decades. Commercial banks find temporary margin relief in this environment because their core business model relies on borrowing short to lend long. However, the broader economy suffers from skyrocketing mortgage rates, elevated corporate refinancing hurdles, and punishing debt-service burdens on capital-intensive enterprises.
The Bull Steepener Sparked by Emergency Rate Reductions
A bull steepener unfolds when short-term yields collapse far more rapidly than long-term yields. Here, bull refers to rising bond prices, heavily concentrated at the front end of the maturity spectrum. This regime change rarely signals tranquil prosperity; instead, it marks the exact inflection point where economic deterioration forces a central bank to abandon restrictive policy and commence aggressive rate cuts. While financial media often celebrate impending liquidity infusions, historical data demonstrates that economic recessions and equity drawdowns frequently materialize during this un-inversion phase. Just as elite sprinters optimize Sprint acceleration mechanics and 4 essential rules that build explosive track speed by dissecting force angles against the starting blocks, sophisticated bond desks evaluate rate velocity to determine whether a steepening curve signals growth or systemic distress. When the short end plummets in response to failing labor markets or banking sector fragility, the resulting bull steepener exposes an economy transitioning from high-rate exhaustion to outright stagnation.
The Persistent Flatline Signifying Liquidity Exhaustion
A flattened curve emerges when the yield differential across all maturities narrows toward parity. This phenomenon occurs when long-term optimism deteriorates while short-term rates remain persistently elevated, squeezing the banking sector’s net interest margin down to razor-thin fractions. When the yield spread between three-month paper and thirty-year debt shrinks to negligible levels, financial intermediaries lose the economic incentive to underwrite long-term commercial loans or finance speculative ventures. Credit growth decelerates, private equity dry powder sits idle, and corporate treasurers switch from capital expenditure toward working capital preservation. A persistent flatline acts as a liquidity tourniquet, demonstrating that debt markets are caught in an existential tug-of-war between restrictive monetary policy and a private sector unable to support higher hurdle rates.
The Distorting Influence of Central Bank Balance Sheets
Traditional bond models assume that sovereign yields reflect free-market price discovery among independent investors. Yet, central bank balance sheets have fundamentally rewritten how duration is priced. Through large-scale asset purchase programs, monetary authorities regularly step onto the open field as price-insensitive buyers.
Modern quantitative easing reshaped traditional yield curve mechanics by absorbing billions in duration from private markets. By purchasing massive quantities of intermediate and long-term sovereign obligations, central banks artificially depress the term premium, pushing investors out of risk-free paper and into riskier assets like corporate debt and equities. Conversely, when monetary authorities embark on quantitative tightening, they allow maturing bonds to roll off their balance sheets without reinvestment, forcing private capital to absorb an ocean of debt issuance. As documented in Federal Reserve Bank of New York capital markets research, tracking maturity spreads and market-implied rate expectations requires stripping away these balance-sheet distortions to isolate the true economic signal. When structural deficits collide with reduced central bank absorption, the yield curve can twist violently, producing disjointed price action that defies conventional macroeconomic modeling.
Strategic Portfolio Positioning Across Yield Regimes
Navigating shifting yield regimes requires an active alignment of asset allocation with maturity profiles. Investors who understand the term structure can actively insulate their wealth from severe drawdowns while positioning capital to harvest generational yields.
During inverted or deeply flattened regimes, holding short-duration instruments such as Treasury bills or prime money market funds provides an asymmetric advantage. Investors earn elevated cash yields without incurring the capital risk associated with price volatility on longer bonds. However, maintaining excessive cash allocations for too long exposes portfolios to severe reinvestment risk once the monetary easing cycle begins. When the curve shifts toward a bull steepener, extending portfolio duration into intermediate and long-term bonds locks in yield while generating substantial capital gains as prices appreciate. Alternatively, navigating persistent inflationary environments and bear steepeners necessitates barbell strategies, where capital is split between ultra-short cash equivalents for liquidity and inflation-protected securities or floating-rate debt to survive yield expansions. Grasping these yield curve mechanics shields investors from the siren song of short-term market noise, offering an analytical framework rooted in the immutable physics of debt.